Tech Tracker: GDRX Sets Second Target Price at $10.30 (22.6%), EXEL Exhibits Symmetrical Triangle Formation Breakout Pattern
Our in-house experts provide daily technical analysis to assist investors in making informed trading decisions and enhancing their trading strategy.
Here’s a summary of the technical analysis for August 3rd:
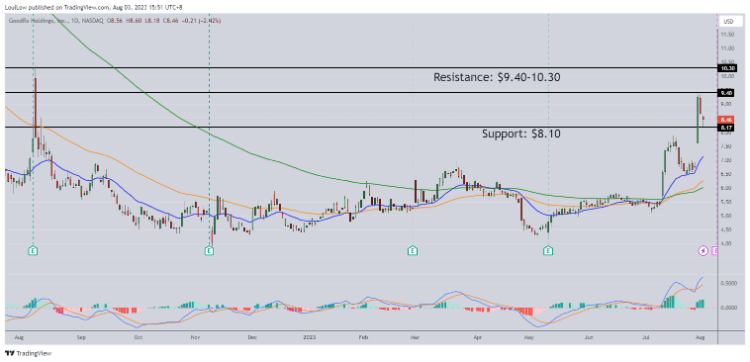
Stock Name: GoodRx Holdings Inc ( $GoodRx Holdings GDRX$ )
Entry: Buy above $8.40
Target: $9.40 (11.9%), $10.30 (22.6%)
Stop: $8.10 (-3.6%)
Shariah: Yes
Technical: Hammer candle
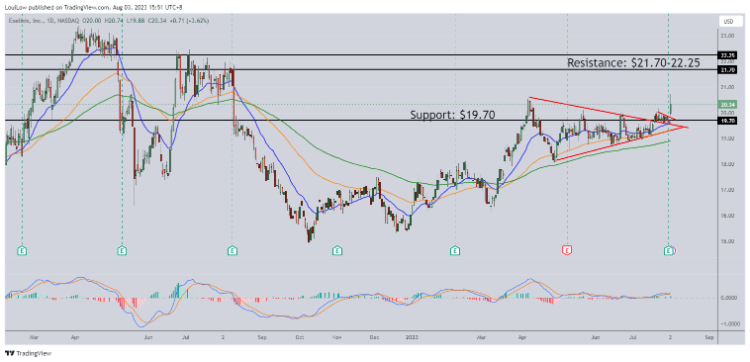
Stock Name: Exelixis Inc ( $Exelixis, Inc. EXEL$ )
Entry: Buy above $20.30
Target: $21.70 (6.9%), $22.25 (9.6%)
Stop: $19.70 (-3.0%)
Shariah: Yes
Technical: Symmetrical triangle formation breakout
More about Loui:
Loui Low leads a team of analysts to perform equity and economic research and to provide investment advisory services to the organization's sales team, fund manager and retail fraternity. He has more than 10 years of experience in the stockbroking industry.
He graduated with a Bachelor of Science in Statistics from University of Malaya. He also holds an STA Diploma and is a member of the Society of Technical Analysts (MSTA) United Kingdom.
More about the tech tracker :
Our technical analysis section is updated daily and features insights from our expert analyst, Loui, on the stock market. Traders may find some trading inspiration from Loui's views.
More Insights from Loui: